- June 18, 2012: Orientation Day.
At the beginning of the day, Dr. Yazdani briefly described the REU program and introduced all the faculty staff, Graduate Teaching Assistants (GTAs), and other people that were going to help us in the six-week program. These include Dr. Yvetter Weatherton of Environmental engineering department and Dr. Stephanie Daza. After that, Dr. Yazdani gave on overview of the project including all the upcoming activities and our responsibilities. He mentioned that our task was going to be huge in the following days and showed us some examples of the works of previous years' participants such as: websites, posters, powerpoint slides , and Research log. After Dr Yazdani's overview of the project, the five projects to be worked on were briely introduced. These are Mitigation of Expansive soil Damage and Earhquake Research; Air Dispersion Modeling: Planning for Airborn Terrorism Releases; Effects of extreme wind loads on structures; Hacker Detection: Evaluation and Improvement; and Power Grid Failure. These were presented by either the faculty staff in charge (mentors) or GTAs. After the presentation of Aravind Pedarla who's a geotechnical PhD student at UTA, I become more interested in the expansive soil and Earthquake project. He showed us some pictures of the soil stabilization technique or the application of that method in the real world. The next presenter was Terrie Davis who talked about participant reimbursements. After her presentation, we took an hour lunch break which was followed by Dr Daza's presentation. Dr Daza mainly talked about benefits of the REU and the past experience of the REU programs (2010 and 2011) at UTA. Furthermore, she went over the informed consent for UTA REU Site Participants which is a document comprising the facts and implications that each REU participants has to agree with. Each partipant had to read through the informed consent and sign it.
The last event of the day was to complete the pre-survey that basically REU organizers use to know what each REU participants thinks about the REU program and what he thinks about engineering, mathematics, science, and technology.
Below is an example of how a UTA-REU informed consent looks like:
 |
| Fig1. Informed consent. |
- June 19, 2012: Ethics Workshop
Research Ethics.
At the beginning of the day, Dr weatherton explained what are research ethics and and provided the reason why they are so important. She started by providing acceptable norms that make a research reliable. I personally learned that a good research should tell the truth and not mislead the readers. Also, I learned that a good research has to be clear or free from any errors.
The other important fact to consider, when conducting a research, is to respect all research collaborators. Trusting each other and respecting the ideas of every member of the research team is very important for any research work.
Additionally, I learned that a researcher should not use other publishers' work without their permission. According to Dr Weatherton, that is not different from stealing what does not belong to you. In other words, sources provider should get credit of his publication. Dr Weatherton mentioned credit should be given through citation of the author's publication. This would lead, of course, to the avoidance of plagiarism.
Furthermore, when conducting a research the bad attitude of making something up that never existed before should be avoided. This attitude is called the fabrication of data.
Lastly, Dr Weatherton mentioned that an accountability to the public is very important when conducting a research. This is done by ensuring the protection of human and animal subjects or paying attention to human rights.
Professional Ethics for Engineering.
This is a set of standards that engineers have to abide to so that safety, health and welfare of the humankind can be ensured. There are a set of fundamental principals and fundamental canons that engineers have to stand for.
Today, Dr weather spend the entire afternoon explaining the fundamental canons of 4 main engineering professional conducts. These are:
NSPE: National Society of Professional Engineers
ASCE: American Society of Civil Engineers.
ASME: American Society of Mechanical Engineers
IEEE: Institute of Electrical and Electronics Engineers.
The Fundamenal canons and explanation of each professional conduct can be found on the following links:
The last thing we did before wrapping up, was to analyze an experience life of a professional engineer Sara who got into trouble at work due to various reasons. We used the fundamental canons to analyze Sara's case.
| Fig.2. A Book of code ethics. |
According to Dr Weatherton, The bottom line for both research ethics and professional ethics is:
" Do the Right Thing"
- June 20, 2012: Stabilization of the Leaning Tower of Pisa & UTA Campus Tour
- Meeting Aravind for the first assignment. Today, we spent the first half of the day touring UT Arlington campus with the help Megan ( summer tour guide at UTA). After lunch, we had a short meeting with the PhD student who's was going to help us throughout this REU. He gave us an overview of what was planned for us in our project and introduced us to some of his PhD students colleagues: Justin David Thomey and Minh Lee. It was a great opportunity to meet his colleagues because, after asking them to help us in our geotechnical project, they accepted to do so. Both of these PhD students, together with Aravind, are working different geotechnical projects. With the help of Aravind they accepted to use our help in some of their work. This is definitely going to be a great opportunity for us since they'll provides with some in incites about geotechnical work. After meeting Aravind's friends, he gave us an assignment. This assignment was to write a 3 pages paper on the actual problem and stabilization works carried out on the Leaning Tower of Pisa. the assignment was due on the following Friday.
- Leaning Tower of Pisa.
 |
| Fig.3 Drawing and dimensions of the Leaning Tower of Pisa |
II. Subsoil Information
The first step in stabilizing the tower’s subsoil was the soil
investigation. As a result of this, the three main layers of subsoil were
found. The deepest layer was made up of dense marine sand with the next layer
being soft marine clay and the very top layer consisting of soft sandy and
clayey silts. When the tower was originally built the foundation was too
shallow, meaning the foundation is sitting on soft clay. This soft clay did not
have the necessary bearing capacity which is why the tower began to settle
after the third level. Also, a water table lying only 1 to 2 meters below
the surface was found under the top layer of soil. The piezometric levels of
the groundwater for the two sides of the tower were at different heights. This
fluctuation of the water table was mainly caused by the two major rainy seasons
encountered in Pisa (Autumn and Winter). This difference in water table levels
for both the north and south sides was found to be the main cause of the
tower’s rotating problem. Because the south side has a higher water table
during the rainy season, the clay on this side absorbed more water which caused
the clay to shrink more than the north side when the water table went down
during the dry months. This means that there was more movement and settling on
the south side than the north side causing the inclination of the tower.
III. Stabilization Methods
Three main solutions were found to be reliable. For their first attempted
solution the geotechnicians
decided to use an underexcavation method. To do this, geotechnical engineers
used boreholes, also known as the auger boring method. A series of holes were
drilled towards the north side of the foundation. The maximum number of holes
to be drilled, as well as the interval between them, was determined. After the
entire process of soil extraction, the tower gradually started to rotate
towards the north side. In other words, this underexcavation method was a
success for the hired crew. Another approach used to stop or reduce the tilting
problem was to attach the shallow foundation of the tower to the nearby
concrete ring. This ring was called the Catino wall. To do that, the
geotechnical crew used tensioned steel cables and steel reinforcements which
were both embedded in a concrete slab. This concrete slab was a liaison between
the north side of the tower’s foundation and Catino wall. This approach become
a success as well because the tilting problem was significantly reduced.
Lastly, the geotechnical crew decided to install a drainage system under the
north side of the foundation. The main purpose of this drainage system was to
control the level of the groundwater table of the subsoil. To achieve this, the
crew connected a well at the end of the drainage system and used this well to
help them pump water out from under the foundation at the desired rate. This
approach become a success too because, after the installation of the drainage
system, the piezometric surface for both the north and south side of the tower
was maintained at a constant level.
 |
| Fig.4 Leaning Tower of Pisa |
- June 21, 2012: Modification and Stabilization of Soils and Base for Use in Pavement Structures
Today was kind busy due to a double work I had to finish. The first task of the day was to finalize the four pages paper about the Leaning Tower of Pisa and submit it. Also, I had to read a soil stabilization manual from the Texas Department of Transportation.
After taking the breakfast, Ricky and I headed to the main UTA library to format the final draft of the four page paper and print it out. Printing was a challenge for us because we did not know that students have to buy a swipe card used to print at the library computer. After asking for help at the front desk, we were able to print the paper due and submit it. However, the PhD student who' s helping us suggested to redo the paper and add some graphs and pictures in it, and detail it a little bit more. This is something we decided to do on the following day.
In the afternoon, I spent most the time reading the manual on modification and stabilization of soils. This manual is comprised of three main chapters and an introduction. The main chapters are the subgrade treatement, base treatment, and Rehabilitation of Salvaged Existing Materials.
Below is an example of flowcharts that illustrate steps to be followed when treating a subgrade or a base and when rehabilitating salvaged existing materials. Also, an example of decision trees used to select an additive is presented.
 |
| Fig.5. Flowchart for Subgrade Soil Treatment. |
 |
| Fig.6. Additive Selection for Subgrade Soils Using Soil Classification. |
- June 22, 2012: Procedure Used to Determine the Sulfate content in a Soil.
The starting point, when determining the sulfate content, is to take soil samples at the area of interest. In the IPL project, this area would be the entire way of the pipeline through soil. Sampling is usually done by using the auger boring method or other testing methods. Afterwards, samples are labeled and taken to the lab. The depth at which the sample has been taken must be mentioned on the label. Also, samples are kept in a cooling room in order to keep them at their normal moisture content. The next phase is to crush the soil sample into smaller particles or powder-like material. This process is called pulverization. To achieve this, a sample soil is passed through the grounding mill or a pulverizer. This equipment must be thoroughly cleaned and the sample soil should be oven-dried to reduce or stop its stickiness on the walls of the grounding mill. Next, 10 grams of the crushed soil are placed into a 300ml flask. Then 100 g of distilled water is added. The flask should be completely cleaned before any addition of both soil and water. Also, distilled water is used to clean the flask. The next step is to cover the flask with a parafilm, stir the solution for a short while and allow it to sit for one day. After all 24 hrs have passed, the sample solution is shaked for 30 minutes using an agitator. This is followed by the centrifugation which involves pouring the soil sample in centrifuge tubes and place them in the centrifuge. Centrifugation of the solution takes about 30 minutes. After 30 minutes, centrifuge tubes are removed from the centrifuge and the water-like solution resulting from centrifugation is filtered through a 0.1 Micrometer filter paper. Then, the filter is transferred to a flask which covered and subsquently heated. The heat, in this case, plays a role of a catalyst. When the solution starts to boil, 40ml of 10% BaCl2 are added to the solution. Next, the flask is removed from the heater and allowed to cool of a short while( approximately 15 minutes). Then, the flask containing the solution is place in the oven for about 12 hours. Meanwhile, a 0.1 Micrometer filter paper is wetted using distilled water and placed in an aluminum weighing tin which subsequently placed in the oven to dry it overnight. On the next day, the filter paper and weighing tin are removed from the oven and weighed. The mass value is recorded. Next, The dried filter paper is used to filter the precipitate solution from the oven. This time, all precipitate must be removed from flask using Distilled water. Subsequently, the filter paper is placed back into the tin Aluminum. These 2 are placed back into the oven to allow the filter paper dry overnight. On the next and last day, the filter paper together with the weighing tin are weighed and the value is recorded. Finally, the two recorded masses of filter paper and weighing tin before and after the retainment of the precipitate, are used to calculate the sulfate content. This is done in an excel spreadsheet.
 |
| Fig.7. second day of sulfate content test. |
- June 23 and June 24, 2012: ( Weekend): Case Studies of Sulfate Induced Ground Heave.
During the weekend, I spent my time especially afternoons, reading different case scenarios of sulfate induced ground heave. After, reading through each of these case studies, I was able to understand how my project is very useful in bringing solutions to expansive soil issues. The problems mentioned in these articles happen under the foundation of commercial structures, residential houses, road pavements and so on. The following is the flow of topics for most of these articles.
Most of these articles starts by presenting the main cause of the Heave problem. Most of the speculations mentioned that the heaving was caused by the reaction of the Lime stabilizer and the minerals of soil especially compounds with a very high sulfate content. This reaction normally results into a new chemical compound known as ettringite. This resulting compound has a very high swelling ability and when formed it normally leads to the expansion of soil.
Afterwards, possible solutions and future prevention methods are presented in each article. For an expansive soil with the sulfate content which higher than 2000 ppm, the best solution was to remove the soil and bring a new, appropriate and less expansive material with less than 2000 ppm of sulfate content. This is because methods of stabilizing a soil with a very high sulfate content have not been discovered yet. For an expansive soil with less than 2000 ppm of sulfate content, Lime stabilization or cement stabilization were proved to be effective treatment methods of expansive soils. One of my favorite case studies can be found on the following link: FORENSIC INVESTIGATION OF A SULFATE-HEAVED PROJECT IN TEXAS. This link can help my blog view to appreciate the work done by geotechnical engineers trying to figure out solution to expansive soil issue.
 |
| Fig. 8.Sulfate-induced heave of the road pavement near Joe Pool lake in Texas |
Week 2: Stabilization of Austin's Expansive Soil: Step 1.
June 25,2012 was the beginning or the starting day of our expansive soil stabilization project. The area of interest in our project is the City of Austin, Texas. This means that the sample of soil we were assigned to Stabilize is from Austin city. Since UTA geotechnical lab had samples from almost all states of US, we were fortunate to find the Austin's soil in the lab's stock. This saved expenses of the soil sampling. To stabilize our sample correctly we followed the flow chart presented in
figure 5. During this first week of the experiment, we were able to finish the first step of the expansive soil stabilization technique. This first step consists of soil exploration, material sampling, and soil classification. As I mentioned above, we did not do any soil exploration or material sampling, since we used the material available in the lab ( Austin's expansive soil).
figure 5. During this first week of the experiment, we were able to finish the first step of the expansive soil stabilization technique. This first step consists of soil exploration, material sampling, and soil classification. As I mentioned above, we did not do any soil exploration or material sampling, since we used the material available in the lab ( Austin's expansive soil).
- June 25, 2012: Atterberg Limits : Liquid Limit, Plastic Limit and Plastic Index.
Today, we determined 2 Atteberg limits of the expansive soil from Austin, Texas. These are liquid limit and plastic limit. Both parameters help to indicate the transition of changes of the soil phases. In other words, the plastic limit indicates the transition of soil from semi-solid phase to plastic phase and the Liquid limit indicates the transition of plastic phase to liquid phase. Also, we calculated the plastic index which can be obtained by subtracting the plastic limit from the liquid limit. This Plastic limit is so helpful when the expansive behavior of a soil especially clayey soil is to be determined. A clayey soil can be categorized as highly plastic, slightly plastic, non-plastic and so on depending on the range of plastic index it falls into.
 |
| Fig.9 . Liquid limit and plastic limit tests |
- June 26, 2012: Atterberg Limits Results and Day 1 of Sulfate Content Determination
- Atterberg Limits Results.
Trial Number
|
1
|
2
|
3
|
4
|
Container ID
|
LL 1
|
LL 2
|
LL 3
|
PL 1
|
Mass container(Mc)
|
32.4 g
|
22 g
|
32.90 g
|
28.8g
|
Mass of moist soil +
container(M1)
|
61.9g
|
46.3 g
|
58.8 g
|
38.5g
|
Mass of dry soil +
container( M2)
|
51.9 g
|
38.3 g
|
49.8 g
|
36.9g
|
Mass of moisture (Mw)
|
10 g
|
8 g
|
9g
|
1.6g
|
Mass of dry soil(Ms)
|
19.5 g
|
16.3g
|
16.9g
|
8.1 g
|
Moisture (w)
|
51.28%
|
50.96%
|
53.25%
|
19.76%
|
Number of Cranks
|
24
|
20
|
16
|
|
Liquid Limit (LL)
|
51.04%
|
|||
Corresponding plastic
Limit
|
19.76%
|
|||
Plasticity index
|
30.84%
|
The Plastic Index we obtained shows that the soil we were working with was highly plastic. The range of plastic Index for clayey soils with a high plasticity is normally between 20-40.
For the discussion or interpretation of the results, please refer to Atterberg Limits Test Post.
2. Sulfate Content in a soil Sample from Austin:Day 1.Pulverization and Addition of DI Water.
Determining the concentration of sulfate in a clayey soil sample involves a series of steps. These steps are nothing other than chemical reactions that may take few minutes to so many hours.
On the first day of the experiment, we crushed or pulverized the sample soil. It took us less than 5 muntes to crush the sample soil we needed. However, cleaning the grounding machine or the pulverizer was not fun at all. This is because the machine has to be thoroughly cleaned before using it to crush any other soil sample. In other words, all parts of the machine have to be vacuumed or completely cleaned before crushing any other material. After crushing the soil we obtained a powder-like sample.
 |
| Fig 10. Soil Pulverization |
Next, we mixed this sample with distilled water. These two were mixed on a 1:10 ration of soil per distilled water. a 300 ml flask was used to mixed water and soil. Afterwards, we covered the flask with a parafilm and allowed the soil solution to sit for 24 hrs. This was pretty much the end of the first day.
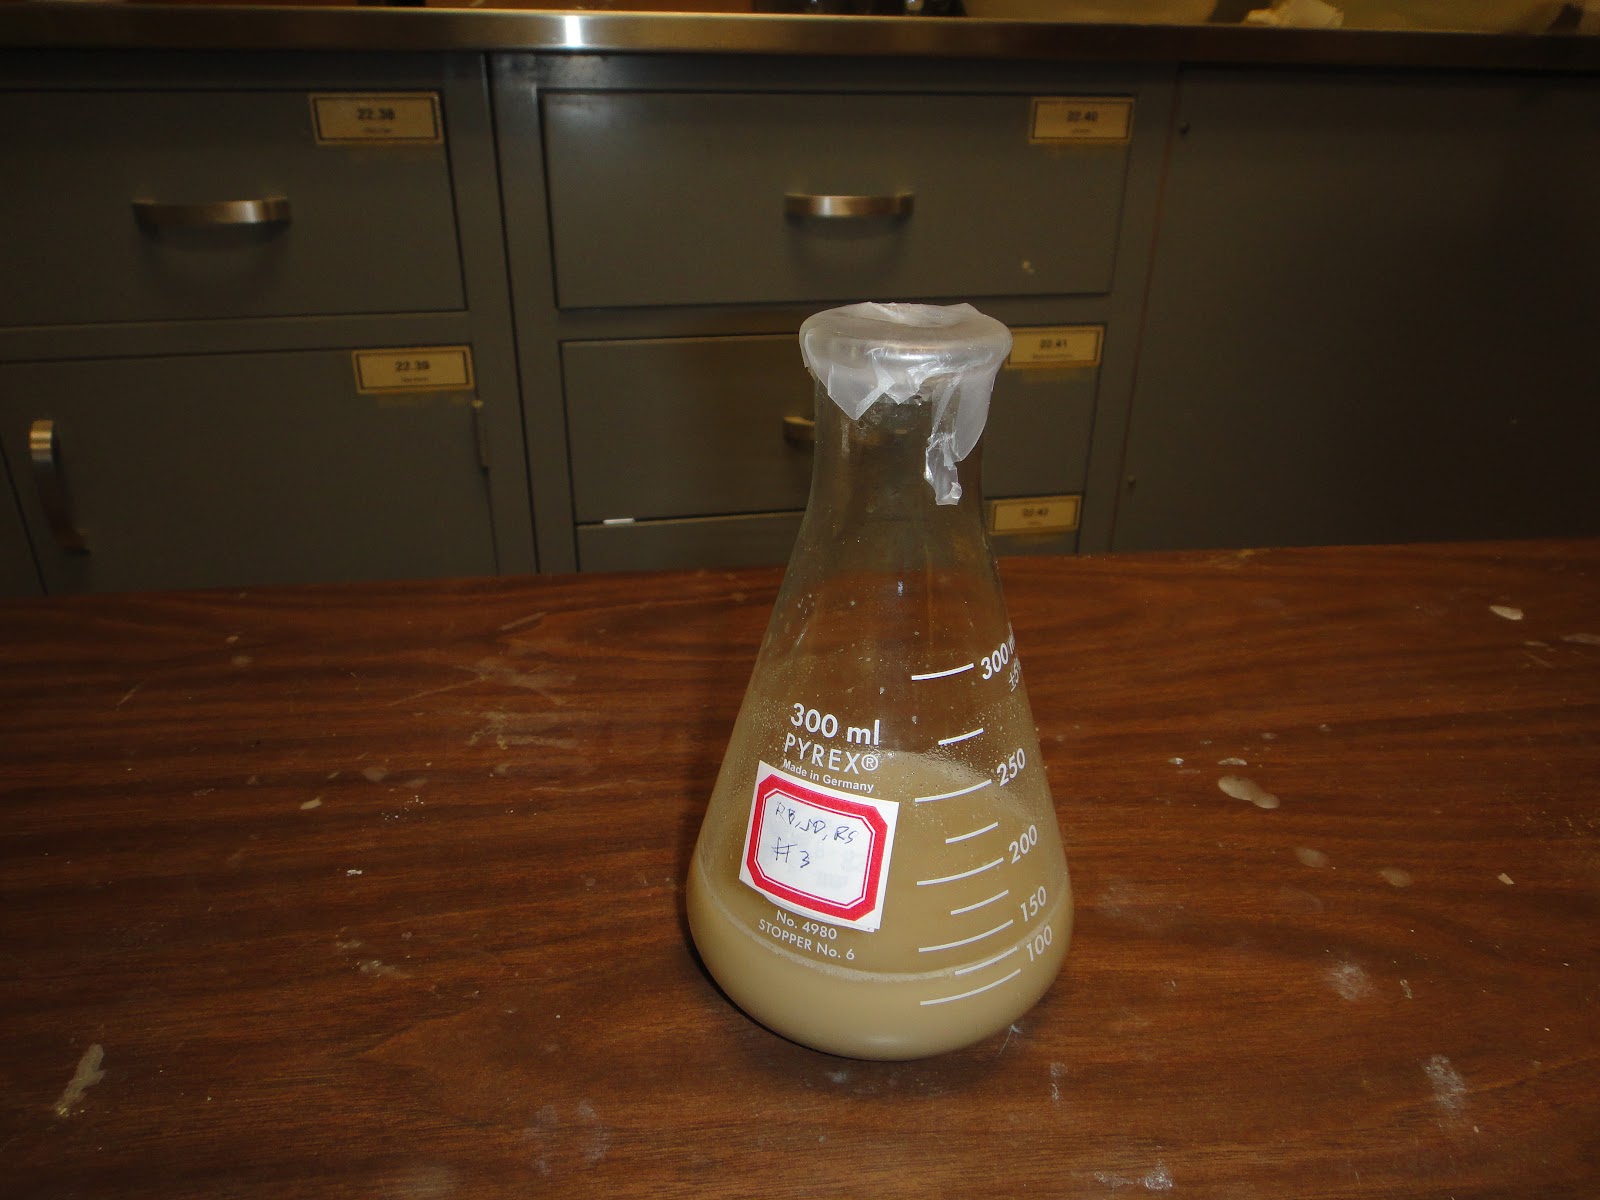 |
| Fig.11. Solution of Expansive soil and distilled water. |
3. Grad level soil Mechanics class: Soil Behavior.
One thing I forgot to mention is the soil Mechanics we attended that goes from 8:00 am to 10:00am. The lecturer of the course is Dr Bhaskar Chittoori. During the class, we had the opportunity to learn different techniques used to determine the mineralogy of clayey soils. Dr Bhaskar explained four methods that are commonly used to determine the types of minerals of any expansive soil. Normally, the geotechnical engineers are interested in four minerals of clay. These are: Kaollinite, illite, Montmorillonite, and Smectite. These four minerals are most encountered in clay soils.
The first method used to determine the type of minerals in clayey soils is the X-ray diffraction test; the second is Thermal Analysis; the third is chemical Analysis.
- June 27, 2012: Day 2 of sulfate content Determination & 3-D Swell Test of Stabilized expansive soil.
- Day 2 of sulfate content Determination
 |
| Fig.12. The diluted soil sample being shaken. |
 |
| Fig.13. centrifugation of the soil sample |
 |
| Fig.14. Set up of Supernatant filtration |
The filtrate is diluted up to 200 ml and heated up. the heat is a reaction catalyst in this case. Next, 40 ml of 10 % Barium Chloride solution is added to the boiling filtrate.The resulting solution is removed from heat and allowed to cool for about 15 minutes. After that, the flask is placed into the oven for 12 hours. The temperature of the oven is brought to 140 Fahrenheit. Also, a 0.1micrometer is wetted using DI water and placed into a weighing tin. These are kept into the oven as well for overnight drying. The main reason of wetting the filter paper and oven-dry it is to avoid the impact of its initial moisture content ( usually experimental room moisture) on the experiment.
After day 2 of sulfate content determination, Naga, who is a graduate school student showed us an experiment of 3-D swell test that he was working on in his project.
2. 3-D Swell Test of Stabilized expansive soil.
The following table shows the final results we got in our experiment.
With Weight 1= weight of dry filter paper + weighing tin ( before filtering the precipitate).
and Weight 2= weight of dry filter paper with retained precipitate + weighing tin ( after filtering the precipitate).
After the short lab time today, we headed to the library and tried to get done with some of the dues. We worked on the lab report of the Atteberg limits test and fortunately we were able to finish it in just 1 hr.
Today, we conducted a swell test on the Austin's expansive soil. In this test, we used a soil sample with a known optimum moisture content (OMC) and maximum dry density (MDD). In other words, the standard proctor test had been already conducted to determine the maximum dry density and its corresponding optimum moisture content. The initial weight of the sample and the additional moisture ( added water) were recorded. These quantities were calculated based on the density of the soil, the volume of the cylindrical mold and the optimum moisture content. In other words, the method we used to determine the additional water is the same as the one used to determine additional water during soil compaction on the field. The next step was to fill the cylindrical mold with the moist soil and compact it. To do the compaction, we used the triaxial compression equipment. At the desire level of compaction, we removed the compacted sample from the equipment.
Afterwards, the compacted disc of soil is removed from the mold and its dimensions are recorded ( height, diameter, and weight). While the the disc is being removed, a complete set up of the swell test apparatus can be done (figure 17). The apparatus we used included a combination of a large metallic reservoir, a brass sample ring, a porous stone, two surcharge weights, an indicator support, and a dial indicator reading up to 0.001 inches (figure 17). During the setup of the apparatus, the compacted disc is placed into the apparatus and covered with a filter paper which is used to ensure only the transfer of water through the soils. The next step is to hydrate the soil sample by the addition of distilled water. This water percolates through the filter paper and causes the soil sample to swell. The swelling rate is high within the first hour after the hydration of the sample and decreases with time. The next step was to record the 1 dimensional swell which is read on the dial indicator in inches. The readings are taken at different time intervals. In our project, we recorded the 1-D swell from 30 sec up to 36 hrs. The time intervals we used are different since I was hard to take a reading for every minute of the 36 hours.
The recorded data are presented in the One Dimensional Swell Test post.
As every Tuesdays and Thursdays, we had to attend the soil mechanics class from 8:00 am to 9:30 pm. This time, we learned the 2 components that define the engineering properties of soil. These are the soil composition and environment factors.
One interesting statement I heard from the lecture goes like this: "It's always hard to come up with the exact soil composition or soil properties". Dr Bhaskar said.
 |
| Fig 15. Heating the filtrate and adding the BaCl2 to it |
2. 3-D Swell Test of Stabilized expansive soil.
After the second day of sulfate content measurement, we spent half an hour with Naga who is currently working on his PhD degree in geotechnical engineering. He explained to us how the 3-D swell test is conducted on lime-stabilized soil with high sulfate content (more than 2000 ppm). The main purpose of his project was to figure out how expansive soil with high sulfate content can be effectively stabilized using common additive such as lime. As a reminder, his told us that, so far, no method has been found to stabilize such kind of soil. The only parameter he was playing with in his experiment is the curing time.Naga described to us how the free swell is measure. Briefly, he mentioned that the free swell is the percentage of the sample's volume change over a certain period of double inundation.
The free swell formula is [(Vwet-Vdry)/Vdry]*100% where V is volume.
 |
| Fig.16. Curing and dimensions measurement after swelling. |
- June 28, 2012: Day 3 of Sulfate Content Determination & Soil Behavior class
 |
| Fig.17. Filter paper placed back into the oven after filtering the precipitate solution. |
Apart from the experiment, we attended the Soil Behavior class again. The professor spent time explaining the mineralogy of expansive soil as a continuation of the previous lecture. He solved some example problems to help us understand his lecture.
- June 29, 2012: Day 4 for Sulfate Content Determination & Atterberg Limit Lab Report
The following table shows the final results we got in our experiment.
Sample 1
|
Sample 2
|
Sample 3
|
|
Weight 1 (grams)
|
1.2116
|
1.2198
|
1.2156
|
Weight 2 (grams)
|
1.2182
|
1.2263
|
1.2216
|
Sulfate content in parts per million (ppm)
|
271.63
|
267.514
|
246.94
|
With Weight 1= weight of dry filter paper + weighing tin ( before filtering the precipitate).
and Weight 2= weight of dry filter paper with retained precipitate + weighing tin ( after filtering the precipitate).
 |
| Fig.18. Weighing the filter paper with retained precipitate and the weighing tin |
- June 30 and July 1, 2012: ( Weekend): Reading of Expansive Soils-Problems and Practice in Foundation and Pavement Engineering.
| Fig.19. expansive soils book |
Week 3: Stabilization of Austin's Expansive Soil: 1-D Swell Test
- July 2, 2012: One Dimensional Swell Test for the Control Soil or Non-treated Soil .
Today, we conducted a swell test on the Austin's expansive soil. In this test, we used a soil sample with a known optimum moisture content (OMC) and maximum dry density (MDD). In other words, the standard proctor test had been already conducted to determine the maximum dry density and its corresponding optimum moisture content. The initial weight of the sample and the additional moisture ( added water) were recorded. These quantities were calculated based on the density of the soil, the volume of the cylindrical mold and the optimum moisture content. In other words, the method we used to determine the additional water is the same as the one used to determine additional water during soil compaction on the field. The next step was to fill the cylindrical mold with the moist soil and compact it. To do the compaction, we used the triaxial compression equipment. At the desire level of compaction, we removed the compacted sample from the equipment.
 |
| Fig. 20.consolidation of the Austin's soil sample to be used for swell test |
Afterwards, the compacted disc of soil is removed from the mold and its dimensions are recorded ( height, diameter, and weight). While the the disc is being removed, a complete set up of the swell test apparatus can be done (figure 17). The apparatus we used included a combination of a large metallic reservoir, a brass sample ring, a porous stone, two surcharge weights, an indicator support, and a dial indicator reading up to 0.001 inches (figure 17). During the setup of the apparatus, the compacted disc is placed into the apparatus and covered with a filter paper which is used to ensure only the transfer of water through the soils. The next step is to hydrate the soil sample by the addition of distilled water. This water percolates through the filter paper and causes the soil sample to swell. The swelling rate is high within the first hour after the hydration of the sample and decreases with time. The next step was to record the 1 dimensional swell which is read on the dial indicator in inches. The readings are taken at different time intervals. In our project, we recorded the 1-D swell from 30 sec up to 36 hrs. The time intervals we used are different since I was hard to take a reading for every minute of the 36 hours.
The recorded data are presented in the One Dimensional Swell Test post.
 |
| Fig. 21. Disc dimension measurement & Set up of swell test apparatus & Dial indicator |
- July 3, 2012: Lime Stabilization: Sample Preparation & Soil Behavior class
 |
| Fig.22. Sample preparation: 1st step of actual lime stabilization |
As every Tuesdays and Thursdays, we had to attend the soil mechanics class from 8:00 am to 9:30 pm. This time, we learned the 2 components that define the engineering properties of soil. These are the soil composition and environment factors.
One interesting statement I heard from the lecture goes like this: "It's always hard to come up with the exact soil composition or soil properties". Dr Bhaskar said.
- July 4, 2012: Independence day
For more information about Independence, please refer to the post entitled Social Events and Daily Life @ UTA for a 6 week REU program
After extruding the compacted sample we recorded its height, weight, and diameter. Next, we wrapped it in a plastic wrap and labeled it. Lastly, we placed the the labeled sample in the moisture room for a 7 days curing.
The above procedure was the same for all 4 samples including the controlling sample. After 7 days curing, the strength of all four samples would be tested by conducting the unconfined Compressive Strength test on each one specimen.
Beside the compaction of soil samples, we attend the Soil Behavior class as well. This time the professor solved problems for most of the time.
The first step was to mix 50 g of oven-dried soil passing through No.200 sieve with 125 ml solution of 40g/l Sodium Hexametaphosphate ( dispersing agent) in a 250 ml beaker. The solution was allowed to sit more than 16 hours as required by ASTM D422. In our case, the solution was allowed to sit for a day.
- July 5, 2012: Compaction of Stabilized Soil & Soil Behavior Class
 |
| Fig. 23. Extruding the sample is not as easy as it seems. |
After extruding the compacted sample we recorded its height, weight, and diameter. Next, we wrapped it in a plastic wrap and labeled it. Lastly, we placed the the labeled sample in the moisture room for a 7 days curing.
 |
| Fig.24. Compaction of stabilized Soil |
The above procedure was the same for all 4 samples including the controlling sample. After 7 days curing, the strength of all four samples would be tested by conducting the unconfined Compressive Strength test on each one specimen.
Beside the compaction of soil samples, we attend the Soil Behavior class as well. This time the professor solved problems for most of the time.
- July 6, 2012: REU Research,
Graduate Studies and Publications Workshop
8:30
|
Continental
Breakfast
|
|
9:00
|
Introductions
|
REU participants and
guests
|
9:15
|
Overview
of Workshop
|
Dr. Nur Yazdani
Civil Engineering
|
9:30
|
Trends
in Graduate Studies
|
Sebastian Fuentes
Office of Graduate
Studies
|
10:30
|
Graduate
Studies: why, how, where?
|
Dr. Nur Yazdani
Civil Engineering
|
11:30
|
Round
Table Meeting with Student Chapter Leaders
|
|
12:15
|
Lunch
|
|
1:00
|
Round
table Meeting with Graduate Students
|
|
1:45
|
Publications
and Presentations
|
Dr. Anand Puppala
Interim Associate
Dean for Research
College of
Engineering
|
2:15
|
Research
Process and Benefits
|
Dr.
Melanie Sattler
Associate Professor,
Civil Engineering
|
After the overview of the workshop by Dr Yazdani, Mr Sebastian Fuentes, who is the coordinator of UTA office of graduate studies, gave his presentation about their duties. He explained to us the overall process of admission into the UTA graduate program. some of the requirements he mentioned include 3 recommendation letters, GRE or MAT score, proof of 1st year tuition funds, etc... Also, he talked about some funds or opportunities available for graduate school students including, Graduate Teaching Assistantship, Graduate research assistantship, grants ,and others. During Sebastian's presentation, I was able to get answer about my question regarding the difference between a PhD application and a Masters Application.
After Sebastian, we had the opprtunity yo meet student chapter leaders at UTA. We were able to hear from the ASCE ( American Society of Civil Engineers) representative, SHPE (Society of Hispanic Professional Engineers) representative, ASME ( American Society of Mechanical Engineers) representative, and Society of Women Engineers representatives. They all shared the main objectives of their organizations and some of the activities they do during the academic year. I was eager to hear from the members of UTA-ASCE since I need some idea to bring to my school's ASCE club. The next event on the agenda was to meet and talk to some of grad and PhD students who go to UTA. This was a very interesting meeting because we got to hear their experiences as post-undergraduate students. The most important thing I was able to learn is the difference between going to graduate school after college and start a career right after college. Most of them emphasized how finishing with Masters degree or PhD degree is better than just stopping at Bachelors degree. One of the reasons they provided to help us understand their point , is the current competitive career environment that needs a knowledgeable workforce or employees with higher level of study.
After meeting grad and PhD students, we received Dr Puppala who is the Associate Dean for Research college of Engineering. During his presentation, we were able to learn how publications and presentations are made, the difference between some academic publications, and how to behave when making a presentation. At the beginning of his presentation, he outlined the difference between conference papers and Journal papers. As an example, he mentioned that conference papers are typically focused on a certain area or a small idea. As for Journals, he said that they focus on a comprehensive idea in a large scope.
The last presenter of the day was Dr Sattler who is a civil Engineering professor at UTA. she talked about the research process and Benefits of conduting a research. From her presentation, we were able to get answers of the following questions:
- What is a research?
- Where does a research occur?
- Why a research is necessary?
- How a research is conducted?
- Who does conduct a research?
- July 7, 2012: Field Stabilization: Reduction of Slope and Embankment Failure at Grape Vine Lake
Today, we had our first field trip of the REU. This time, we visited Grape Vine lake, where Minh Lee, a PhD student, is working on the slope and embankment stabilization. This project aims at mitigating desiccation cracks that, if not treated, would allow the penetration of rain water and cause the failure of the entire dam embankment. The best field stabilization was to be selected and used to mitigate the superficial failures. The combination of lime and polypropylene fibers was chosen as the best solution and was added to the existing soil. After the stabilization of the soil, the site had to be monitored to evaluate the results of lime-fiber stabilization. This monitoring task is what Minh Lee is working on for his PhD project. At the Grape Vine lake, there is a slope testing area which is devide into five sections. One with control soil, other four with lime-fiber treated soils. These treated soils contain different percentages of lime and fibers. The changes in elevation and change of slope are checked once a month. Today, we helped Minh Lee to check the elevation and slope changes at Grape Vine Lake. A Total Station and a slope indicator were used to achieve this. The corrected data are then transferred to a spreadsheet to calculate the slope and elevation changes. Based on the results, the performance of different percentages of lime and fibers on stabilized soil can be analyzed.
 |
| Fig. 25. Monitoring of slope stabilization at Grape Vine Lake: Surveyind |
- July 8, 2012: Reading The Expansive Soils Book: Recent Advances in characterization and Treatment :
Today, I read the twenty fourth chapter of the book Expansive Soils: Recent Advances in Characterization and Treatment by Amer Ali Al-Rawas and Mattheus F.A. Goosen. In this chapter the authors talk about how the combination of lime and fibers can be used to stabilize expansive soils. Authors mention that the research on lime-fiber stabilization was conduct at the University of Texas Arlington which the host of our REU as well. The author describes an experiment that was conducted to test four expansive soils sampled from four different locations in Arlington, Texas. Three lime percentages were used: 8%, 10% and 12 %. The researcher also used two different amounts of fibers 0.15% and 0.30%. They decided to test the soil samples at three different curing period as well: short (3days), medium (7days) and long (14 days). Next, the authors talk about the sample preparation, and the procedure followed to carry out the test. Afterwards, the results and their discussion are presented. The Plasticity Index (PI), Shear strength, Swelling potential and linear shrinkage of all soil specimens were compared and lime at 8%, fibers at 0.30% and a curing period of seven days were recommended.
 |
| Fig.26. Expansive Soils Book. |
- July 9, 2012: 3-D Swell Test & Reading Recent Advances in characterization and Treatment :
Today, we had a chance to conduct the 3-D swell test. This was very interesting to carry out because it is very used to determined the swelling potential of treated and untreated expansive soils. Also, I was so motivated to carry out this experiment since we had to use some special equipment I have never used or even seen before. Today, we did the first step of the actual test which is going to take approximately seven days. This first step was the samples preparation where we had to prepare two samples of an expansive soil with high sulfate content. One sample had natural or untreated soil whereas the other one was lime-treated. Below is brief description of all steps we followed to prepare our 2 samples.
The first step was to get 2 samples from a pulverized and dry expansive soil. We used 1.6kg for each soil sample. After getting the right amount of soil samples, we added the moisture to the untreated sample. the maximum dry density and optimum moisture content were known in this case.The natural soil and added water were thoroughly mixed and transferred to a plastic bag. Afterwards, lime was added to the other sample of soil and the two were mixed for few minutes ( 4 to 5 minutes). In this case, we decide to use a 6% lime content. This percentage was also calculated by the PhD student in his previous works. The % of lime to be added is a soil's pH dependent. Also, it depends on the soil's properties. Next, we added water or moisture to the soil-lime blend and mixed them together until the moisture is well distributed. Subsequently, the resulting mixture was transferred to a plastic bag as well.
Next, we headed, to the new Civil Engineering lab to compact our samples. In other words, we did not allow any mellowing time to our soils samples. To do the compaction we used a special equipment which is automatic. It was my first to see this machine which know as the Gyratory Compactor. For a quick and effective compaction this machine rotates and compacts the sample at the same time.
After compaction of the untreated sample, we removed it from the mold using a tensile-compression machine. We did the same thing for the lime-treated sample as well. The next step was to record the dimensions (height and diameter) and weight of the 2 specimens. After that, both specimens were wrapped into rubber tissues with both top and bottom faces open. A porous stone was placed at the bottom face of the specimen and two porous stones were placed at the top one. Next, we set up two consolidometer ( each comprised of a dial indicator, the rigid base and a dial indicator support) in a big container and placed our 2 specimens ( 0% lime and 6% lime) on base of each apparatus. Finally, we filled the container with water.The water flow should be closed when water starts to infiltrate into the soil sample from the top face of the specimen. At this time,the initial reading of deformation was recorded. After few hours we took the second reading which was followed by the third reading and so on. For this 3-D swell test, we were required to take 2 readings per day for the entire week (7-days test).
After compaction of the untreated sample, we removed it from the mold using a tensile-compression machine. We did the same thing for the lime-treated sample as well. The next step was to record the dimensions (height and diameter) and weight of the 2 specimens. After that, both specimens were wrapped into rubber tissues with both top and bottom faces open. A porous stone was placed at the bottom face of the specimen and two porous stones were placed at the top one. Next, we set up two consolidometer ( each comprised of a dial indicator, the rigid base and a dial indicator support) in a big container and placed our 2 specimens ( 0% lime and 6% lime) on base of each apparatus. Finally, we filled the container with water.The water flow should be closed when water starts to infiltrate into the soil sample from the top face of the specimen. At this time,the initial reading of deformation was recorded. After few hours we took the second reading which was followed by the third reading and so on. For this 3-D swell test, we were required to take 2 readings per day for the entire week (7-days test).
 |
| Fig.27. 3-D Swell test |
- July 10, 2012:Cowboys Stadium Tour & Reading of Swell Test Manual & Soil Behavior Class
Today, we had tour of the New Cowboys Stadium. This is one of the most beautiful stadiums I have ever visited so far. During the tour, we were able to visit almost all the main sections of the stadium including the locker rooms, Press conference room, media's section, etc... Comparing the cowboy stadium to others stadiums I have seen so far ( Dodgers stadium in LA, Homedepot stadium in LA, Citizens Business Bank Arena in Ontario, California, and son on), I can definitely confirm that it is the most elegant and classiest. For more information about the Cowboys stadium tour, please refer to the post entitled Social Events and Daily Life @ UTA for a 6 Weeks REU program.
 |
| Fig.28. Cowboys Stadium |
After Dinner, I started to read through the swell test lab Manual before writing the lab report for our swell test. I read the procedure followed to conduct the Swell (
ASTM standard D4546-96 procedures). All the steps they mention are similar to what we did to carry out the swell test except that they recommend not to use a filter paper. This was not the case when performed the swell test because we ended up using the filter paper. In other words, If we happen to get an error in our results, the impact of the filter paper on the swell test will be investigated.For more information about the Swell Test, please refer to the post entitled 1-D Swell Test.
Apart from the Cowboys Stadium tour and reading of Swell Test Manual, We also attended the Soil Behavior class. Today, the professor went over Atterberg limits in more details and how they change with respect to the mineralogy of expansive or clayey soils.
- July 11, 2012: Hydrometer Test
The first step was to mix 50 g of oven-dried soil passing through No.200 sieve with 125 ml solution of 40g/l Sodium Hexametaphosphate ( dispersing agent) in a 250 ml beaker. The solution was allowed to sit more than 16 hours as required by ASTM D422. In our case, the solution was allowed to sit for a day.
On the next day, we proceeded with the actual hydrometer test. The first phase was to determine the initial temperature and initial miniscus. To do this, we filled a 1000-ml cylinder with 125 ml of Sodium Hexametaphosphate and 875 ml of distilled water. Next, the solution was thoroughly mixed by turning the cylinder upside down with the top of the cylinder covered by a plastic bag. After that, a thermometer was transferred into the solution to measure the initial temperature. This turned to be the room temperature as we expected. After recording the initial temperature, we transferred the hydrometer into the solution and recorded the top miniscus. This served as the zero correction factor. The difference between the top and bottom minisci was taken as well. This served as the miniscus correction factor.
 |
| Fig. 29.Measurement of the initial miniscus |
After getting the initial temperature and initial miniscus, we proceeded with the second phase of hydrometer test which is getting hydrometer readings from a well-prepared soil-deflocculant-water solution. The solution that we prepared in a 250-ml beaker,on the previous day, was transferred in dispersion cup and thoroughly mixed using a stirring device. Distilled water from a squeezed bottle was used to wash all the solids from the beaker. After a minute and half of mixing, the resulting mixture was transferred in a 1000ml - etched cylinder. Subsequently, the cylinder was filled with distilled water up to 1000-ml mark. After that, the a plastic bag was attached on the top of the cylinder. The soil solution and distilled water were mixed by turning the cylinder upside down for several times. Then, a hydrometer was inserted into the solution. Readings were taken at different at cumulative times (0.25 min, 0.5 min, 1 min, 2 min, 4 min, 8 min, 15 min, 30 min, etc...).
Before the pulverization of soil, we had a soil Behavior class. Today, Dr chittoori solved some problems as a review for the first exam. Even if we did not have to take the exam we learned how to solve problems related to clayey soils.
The first step in conducting the UCS test is to measure the average height, average diameter and the weight of the cylindrical soil specimen. Three heights and three diameter ( top, bottom, and middle) should be taken and used to calculate the average height and average diameter, respectively. Next, the soil specimen was place in the loading frame with porous stones on both top and bottom faces. Afterwards, a triaxial cell was placed and secured by tightening three top knobs. The the Tritech was set at a low speed. Also, a data acquisition system for soils was used to corrected data. During the actual test, The graph indicating the changing applied loads and deformations on the specimens can be visualized. When specimen started to fail, we stopped both the equipment and data acquisition system. At the end of the test stresses and deformations were obtained from the computer software and saved as an excel sheet which is useful in determine the unconfined compressive strength. The same process was performed on the three other specimens. For more information about the UCS test, please refer to the post entitled Unconfined Compressive Strength Test.
Beside the sample preparation, we finalized the 3-D swell test. We took the two readings of the seventh day and removed the two specimens from water. A very remarkable swell was noticed at the the specimen with 0% lime. The lime-treated sample (with 6% lime) did not swell considerably. We took the the average dimensions (height and diameter) and weight of each sample. Subsequently, we performed some calculations to get the volumetric, vertical and radial strains.
For more information about the 1-D and 3-D swell tests, please check the following posts: "One-Dimensional Swell Test" and "Three-Dimesional Swell Test."
 |
| Fig.30. Transfer of the mixed soil solution to a 1000-ml etched cylinder. |
- July 12, 2012: Soil Behavior Class & Pulverization of Soil sample for 1-D Swell Test
Before the pulverization of soil, we had a soil Behavior class. Today, Dr chittoori solved some problems as a review for the first exam. Even if we did not have to take the exam we learned how to solve problems related to clayey soils.
- July 13, 2013: Unconfined Compressive Strength Test.
The first step in conducting the UCS test is to measure the average height, average diameter and the weight of the cylindrical soil specimen. Three heights and three diameter ( top, bottom, and middle) should be taken and used to calculate the average height and average diameter, respectively. Next, the soil specimen was place in the loading frame with porous stones on both top and bottom faces. Afterwards, a triaxial cell was placed and secured by tightening three top knobs. The the Tritech was set at a low speed. Also, a data acquisition system for soils was used to corrected data. During the actual test, The graph indicating the changing applied loads and deformations on the specimens can be visualized. When specimen started to fail, we stopped both the equipment and data acquisition system. At the end of the test stresses and deformations were obtained from the computer software and saved as an excel sheet which is useful in determine the unconfined compressive strength. The same process was performed on the three other specimens. For more information about the UCS test, please refer to the post entitled Unconfined Compressive Strength Test.
 |
| Fig. 31. UCS Test |
- July 14, 2013 and July 15, 2013: Weekend: Reading Expansive Soils book & Starting my Research Paper.
During this weekend, I read the sixth part of the book entitled Expansive Soils: Recent Advances in Characterization and Treatment by Amer Ali Al-Rawas and Mattheus F.A. Goosen. This part talks about lime stabilization of soils. At the beginning of the twenty second chapter of the book, the authors said that lime stabilization technique is widely used in the construction of roads, airports, embankments, or canal linings by intimate mixing with clay subgrades to improve workability, strength and swelling characteristics and bearing capacity ( Nelson and Miller, 1992). Next, They provide the lithological, mineralogical and engineering characteristics of expansive soils. For the most part of the twenty second chapter, the authors compared the engineering properties of treated and non treated soils. These include the physical and index properties, the unconfined compressive strength, swelling characteristics and compressibility characteristics. In the twenty third chapter, the author gave an actual example of lime stabilization technique on a sample soil from a semi-arid region. The methods and materials used on the case study are provided in this chapter. Also, the authors provide results of lime stabilization followed by their discussion. In the next chapter, the authors talk about the combined lime-fiber stabilization of expansive soils. I read this chapter because one of the projects we helped on was about the slope stabilization using lime and polypropylene fibers. After reading the twenty fourth chapter, I was able to understand the Minh Lee's ( the graduate student) project better.
|
| Fig.32. Expansive Soils Book. |
Towards, the end of the weekend, I was able make a plan for a research paper. Although this was an individual and optional work, I wanted to do this so that my writing skills can get improved. Furthermore, I wanted to publish something for the first time.
- July 16, 2013: Finishing the 3-D Swell Test and Preparing the samples for 1-D Swell test for Lime-treated soils.
Beside the sample preparation, we finalized the 3-D swell test. We took the two readings of the seventh day and removed the two specimens from water. A very remarkable swell was noticed at the the specimen with 0% lime. The lime-treated sample (with 6% lime) did not swell considerably. We took the the average dimensions (height and diameter) and weight of each sample. Subsequently, we performed some calculations to get the volumetric, vertical and radial strains.
For more information about the 1-D and 3-D swell tests, please check the following posts: "One-Dimensional Swell Test" and "Three-Dimesional Swell Test."
 |
| Fig. 33. Treated and non-treated specimens after a 7-day inundation ( 3-D swell test). |
- July 17, 2013: 1-D Swell Test for Lime-treated Soils & Soil Behavior Class
Today, we carried out the One-dimensional swell test for the three lime-treated soil specimens ( with 2%, 4%, 6% lime). The procedure was exactly the same as the 1-D Swell Test of the control soil presented previously. The Tritech, triaxial testing equipment, was used to compact the three lime treated soil samples. Like the control specimen, the procedure was to take the dimensions of the compacted specimens, set up the 3 consolidometers, insert the the compacted specimens in each consolidometer, top the specimens with the a porous stone and surcharge loads, adjust the dial indicator and its support, inundate the specimen with water, and finally take the readings. For the detailed information about 1-D swell test, please refer to the following post: "One-Dimensional Swell Test".
As ever Tuesdays and Thursdays, we attended the Soil Behavior class. Today, Dr Chittoori gave a lecture abou the soil fabric of clay. He talked about the arrangement of soil particles and how they group together. I was able to learn the new terminologies that go with clayey soil fabric. Images and drawings were used to help us understand the subject. Even though, the material was mostly theoretical, I enjoyed it because It was my first time to learn about the soil fabric subject.
After the graduation, we headed to the lab to do some hard labor. We helped the geotechnical graduate and PhD students to clean up the geotechnical lab. It was a hard work, but I am glad we were able to help. We had to cleanup the lab because the existing soil samples were kind of old and they wanted to refill the lab with new soil samples and equipment.
After the cleaning session, we spent the entire afternoon working on the hydrometer test and 1-D swell test lab reports. Also, I saved some time of the late night for my research paper and upgrade of my blog. Briefly, today was pretty busy.
As ever Tuesdays and Thursdays, we attended the Soil Behavior class. Today, Dr Chittoori gave a lecture abou the soil fabric of clay. He talked about the arrangement of soil particles and how they group together. I was able to learn the new terminologies that go with clayey soil fabric. Images and drawings were used to help us understand the subject. Even though, the material was mostly theoretical, I enjoyed it because It was my first time to learn about the soil fabric subject.
 |
| Fig.34. 1-D Swell Test of lime-treated soils. |
- July 18, 2013: Graduation Defense Thesis & Lab Cleaning Session & Working on Lab reports.
After the graduation, we headed to the lab to do some hard labor. We helped the geotechnical graduate and PhD students to clean up the geotechnical lab. It was a hard work, but I am glad we were able to help. We had to cleanup the lab because the existing soil samples were kind of old and they wanted to refill the lab with new soil samples and equipment.
After the cleaning session, we spent the entire afternoon working on the hydrometer test and 1-D swell test lab reports. Also, I saved some time of the late night for my research paper and upgrade of my blog. Briefly, today was pretty busy.
- July 19, 2013: GCTS Testing system: Unsaturated Soil Triaxial Testing System (USTX-2000) & Bender Element Test & Soil Behavior Class & Research Paper.
- USTX-2000
For the more informamtion about the description of USTX testing equipment, please refer to the following link: Unsaturated triaxial testing system.
3. Soil Behavior Class and Research Paper.
Before heading to the Civil Engineering Lab for the bender element test and USTX-2000 testing system, we had the Soil Behavior class form Dr Chittoori. Today, Dr Chittoori talked about the interaction of clayey soils and water.
After diner I spent most of my time working on the Research paper which is an individual and voluntary work.
Today, we had an opportunity to learn the basic concept of Liquefaction. Aravind, PhD student, gave us a brief overview of conditions under which the liquefaction of sandy soils occurs. He mentioned that the strength between soil particles comes from the effective stress which is the difference between the total stress and pore water pressure of a soil mass. This pore water pressure can be affected by the change of the water table level. Once the total stress and the pore water pressure are equal, the effective stress of the soil goes to zero and this is main reason behind the liquefaction incident. To help us understand the liquefaction event, Aravind showed us a short demonstration of the sand liquefaction. A compacted and cylindrical soil specimen was used as a load and placed on the top of sand. Next, water was allowed to flow from the bottom of the apparatus and penetrate the sand. As the water level rose, the sand was boiling like water, which means that, at this point, there was no effective stress. After a short while, the load sunk into the sand because the bearing capacity of sand was zero at that moment. Additionally, Aravind said that cohesive soils ( clay and silt) have a high effective stress whereas cohesionless soils usually have a low effective stress.
2. Novel Stabilization of Methods for Sulfate and Non-Sulfate Expansive Soils.
After the liquefaction demonstration, we had a short meeting with Dr Puppala. He gave us a brief lecture on stabilization methods of Sulfate and Non-sulfate expansive soils. Using a US geological Survey map of swelling clayey soils, he showed us the distribution of expansive soils throughout US. Texas is one of the states with a large coverage of expansive soils. Also, He showed us the distribution of high-sulfate expansive soils in Texas. The main objective of his presentations was the assessment of the performance of different additives. These include Type V cement, cement and fly ash, lime and fibers, GGBFS (Ground Granulated Blast-Furnace Slug) and lime itself. After the Laboratory studies, Cost Analysis studies, instrumentation studies, and other kinds of studies, Type V cement was the most recommmended additive. This one was followed by the combination of fly ash and cement on the second place. GGBFS came up as third.
In the afternoon, we started our poster and were able finish few sections of it. Also, I updated my blog as usual.
"So Proud of our team: REU 2012 geotec team. hahahaha...." Jay-D said.
Beside the poster, we also worked on Power Point slides for the coming Friday's presentation. This was not an easy Job because we had a lot to cover. Our project has been more involving and we did so much. In other words, we had to choose what to present and what to discard.
 |
| Fig.35. GCTS testing system |
2. Bender Element Test
Beside the Soil Suction test using USTX-2000, we carried out the bender element test on sand.
The Bender element test is normally used to measure the shear modulus of different types of materials (Go) To get the Go, the Shear wave velocity (Vs) is determined first, by dividing the distance between the top and bottom plates with time required for the waves to pass through the soil specimen. The signals' source ,for the GCTS system, is the ULT-100 Ultrasonic Interface which shoots up signals and these are transferred to the transmitter ( top crystal bender element). Next, the signals quickly pass through the soil sample to the receiver ( bottom crystal bender element). The time required for the signals to pass from the transmitter to the receiver depends on the type of soil and the method adopted to determine the arrival time. From the GCTS software, the signal wave vs. time graph can be visualized and other other soil parameters such as elastic modulus can be calculated. the Shear moduls can be calculated from the following formula:
G0=ρ*Vs
Where: G0 is
the shear modulus, ρ is the bulk density of soil and Vs is the shear wave velocity.
 |
| Fig.36. Bender Element Test |
3. Soil Behavior Class and Research Paper.
Before heading to the Civil Engineering Lab for the bender element test and USTX-2000 testing system, we had the Soil Behavior class form Dr Chittoori. Today, Dr Chittoori talked about the interaction of clayey soils and water.
After diner I spent most of my time working on the Research paper which is an individual and voluntary work.
- July 20, 2013: Liquefaction Basic Demonstration by Aravind & Soil Stabilzation Lecture by Dr Puppala & Workin on Poster.
Today, we had an opportunity to learn the basic concept of Liquefaction. Aravind, PhD student, gave us a brief overview of conditions under which the liquefaction of sandy soils occurs. He mentioned that the strength between soil particles comes from the effective stress which is the difference between the total stress and pore water pressure of a soil mass. This pore water pressure can be affected by the change of the water table level. Once the total stress and the pore water pressure are equal, the effective stress of the soil goes to zero and this is main reason behind the liquefaction incident. To help us understand the liquefaction event, Aravind showed us a short demonstration of the sand liquefaction. A compacted and cylindrical soil specimen was used as a load and placed on the top of sand. Next, water was allowed to flow from the bottom of the apparatus and penetrate the sand. As the water level rose, the sand was boiling like water, which means that, at this point, there was no effective stress. After a short while, the load sunk into the sand because the bearing capacity of sand was zero at that moment. Additionally, Aravind said that cohesive soils ( clay and silt) have a high effective stress whereas cohesionless soils usually have a low effective stress.
 |
| Fig.37. Liquefaction demonstration. |
2. Novel Stabilization of Methods for Sulfate and Non-Sulfate Expansive Soils.
After the liquefaction demonstration, we had a short meeting with Dr Puppala. He gave us a brief lecture on stabilization methods of Sulfate and Non-sulfate expansive soils. Using a US geological Survey map of swelling clayey soils, he showed us the distribution of expansive soils throughout US. Texas is one of the states with a large coverage of expansive soils. Also, He showed us the distribution of high-sulfate expansive soils in Texas. The main objective of his presentations was the assessment of the performance of different additives. These include Type V cement, cement and fly ash, lime and fibers, GGBFS (Ground Granulated Blast-Furnace Slug) and lime itself. After the Laboratory studies, Cost Analysis studies, instrumentation studies, and other kinds of studies, Type V cement was the most recommmended additive. This one was followed by the combination of fly ash and cement on the second place. GGBFS came up as third.
In the afternoon, we started our poster and were able finish few sections of it. Also, I updated my blog as usual.
- July 21, 2012: Field Stabilization: Reduction of Slope and Embankment Failure at Joe Pool Lake
 |
| Fig.38. Measurement of Horizontal movement using an inclinometer and a slope indicator |
- July 22, 2012: Working on REU Poster and Power Point.
"So Proud of our team: REU 2012 geotec team. hahahaha...." Jay-D said.
- July 23, 2012: Working on REU Poster and Power Point
Beside the poster, we also worked on Power Point slides for the coming Friday's presentation. This was not an easy Job because we had a lot to cover. Our project has been more involving and we did so much. In other words, we had to choose what to present and what to discard.
- July 24 and July 25, 2012: Printing the REU Power Point & Finishing Reflection Paper and Website Blog
- July 25, 2012: PowerPoint Presentation Practice& the Final lab Reports
Thank you for sharing that great information. Also, find about Hydrate Lime Suppliers who offers the best quality Hydrate Lime
ReplyDelete